

Gold was supposed to be a barbarous relic — a monetary fossil with no place in the modern financial system. Since 2000, it has delivered an annualised return of 11%, outperforming US stocks, bonds, and Treasuries over every meaningful time horizon. In 2025 alone, it set 53 new all-time highs. Total global gold demand exceeded 5,000 tonnes for the first time in history. This article examines what the data actually says — and why the numbers tell a story that the conventional financial narrative has consistently refused to tell.
KEY TAKEAWAYS
- → Since 2000, gold has delivered an annualised return of 11% — higher than US stocks (8%), US bonds (4.1%), and US Treasuries (2.7%). The ‘non-yielding’ asset has out-yielded almost everything.
- → In 2025, global gold demand exceeded 5,000 tonnes for the first time in history, reaching a record value of over $500 billion. Both tonnage and value records were broken simultaneously.
- → 95% of central banks expect global official gold reserves to increase over the next 12 months — the highest consensus in the World Gold Council survey’s eight-year history.
- → Gold’s above-ground stock grows at only 1.7% per year. The money supply of major currencies has grown at 7.3% per year over the same period. That gap is the mathematical foundation of gold’s long-term purchasing power preservation.
- → Despite gold prices surging 65% in 2025, recycling volumes rose only 3%. Holders are not selling. This is strategic conviction, not speculative positioning.
This is the second part of a two-article analysis on gold and the global monetary order. The first part — The Weaponization of the Dollar: Why Central Banks Are Fleeing to Gold — examined the geopolitical drivers behind central bank gold accumulation. This article examines what the data says about gold’s performance, supply dynamics, and long-term role in the monetary system.
1. The Asset That Was Supposed to Be Dead
There is a specific piece of intellectual history that is worth recovering before examining the data. In 1999, the British government sold 395 tonnes of gold — more than half the UK’s gold reserves — at prices between $256 and $296 per ounce. The decision was made on the explicit theoretical grounds that gold was a barbarous relic, a non-yielding anachronism with no place in a modern reserve portfolio. The sales were announced in advance, suppressing the price further. It became known, with retrospective irony, as Brown’s Bottom — named for the Chancellor of the Exchequer who authorised it.
The theoretical case for gold’s obsolescence was not unreasonable at the time. The Cold War was over. Globalisation was accelerating. US Treasuries offered positive real yields. The dollar’s reserve currency status appeared unchallengeable. Gold’s traditional role as a monetary anchor had been severed with the end of Bretton Woods in 1971. By the standards of late 1990s financial theory, holding a non-yielding asset in a world of abundant liquid alternatives looked like sentimentality masquerading as strategy.
What followed is one of the most instructive stories in modern financial history. Gold bottomed in 1999 and began a sustained, multi-decade appreciation. The global financial crisis of 2008 demonstrated gold’s crisis-hedge properties at scale. The COVID-19 pandemic reinforced them. The weaponisation of dollar reserves in 2022 — examined in detail in the first part of this series — transformed what had been a portfolio hedge into a geopolitical necessity for sovereign reserve managers worldwide.
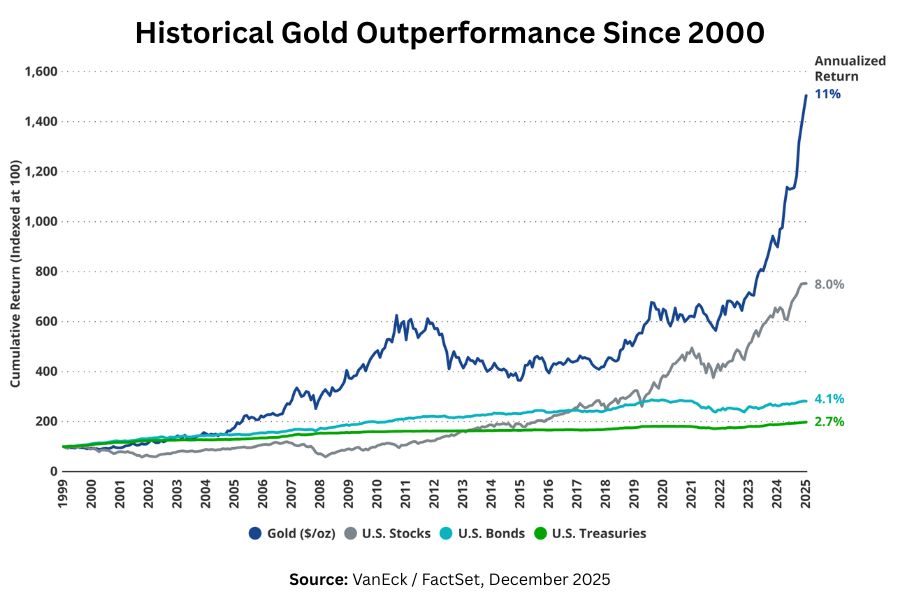
The chart above is among the most powerful single images in contemporary finance. Starting from 100 in 1999, gold reaches approximately 1,500 by end-2025 — an annualised return of 11%. US stocks reach roughly 750, representing an 8% annualised return. US bonds reach around 280 at 4.1%. US Treasuries, the supposedly safe anchor of every institutional portfolio, reach 200 at 2.7%. The non-yielding barbarous relic has, over a quarter century, out-compounded every major asset class in the most sophisticated financial market on earth.
The question is not why gold has performed so well. The question is why the financial mainstream spent twenty years refusing to look at the chart.
2. The Numbers That Changed Everything
The 2025 data represents a qualitative step change, not merely a continuation of the post-2022 trend. Total global gold demand exceeded 5,000 tonnes for the first time in history — reaching a record value of over $500 billion. The LBMA gold price set 53 new all-time highs during the year, delivering an annual return of approximately 65% — gold’s fourth strongest annual performance since 1971 and more than double the returns of US equities over the same period.
What is structurally significant is not the price performance itself, but the composition of demand behind it. Investment demand — bars, coins, and ETFs — smashed the previous annual record that had stood since 2020. Gold ETFs globally attracted 801 tonnes of inflows, the second-highest annual figure ever recorded. US-listed ETFs alone accounted for 437 tonnes of demand, representing more than half of global ETF inflows and reflecting an acceleration in North American institutional and retail positioning.
The demand picture from central banks is equally instructive, but requires careful interpretation. Central banks purchased 863 tonnes in 2025 — below the 1,000-tonne-plus years of 2022–2024, but still 82% above the pre-2022 decade average. The reduction from the prior years reflects tactical caution in the face of rapidly rising prices, not strategic retreat. The Q4 2025 surge to 230 tonnes — 6% above Q3 — confirmed that the slowdown was temporary. Poland’s National Bank was the largest buyer for the second consecutive year, adding 102 tonnes and raising its total holdings toward its publicly stated target of 20% of total reserves.
VanEck’s analysis of gold’s performance across time horizons underscores the breadth of outperformance. Over one year, gold’s annualised return of approximately 77% compared to 16% for US stocks. Over two years, 56% versus 21%. Over three years, 37% versus 21%. Over five years, 18% versus 15%. The outperformance is not a recent phenomenon or a spike driven by a single event. It is consistent across every time horizon examined.
3. Why Gold Works — In Every Environment
One of the most persistent misconceptions about gold as an asset is that it only performs during crises. The data contradicts this directly. Gold has a structural dual property that no other major asset class shares: it is counter-cyclical during periods of economic uncertainty — rising as investors seek safety — and pro-cyclical during periods of expansion, when consumer demand for jewellery and technology applications supports prices. This means gold can contribute positively to portfolio performance across both fear and growth environments.
The World Gold Council’s long-term research framework establishes that gold’s long-run return closely mirrors global GDP growth, making it materially higher than inflation over full economic cycles. This reframes gold fundamentally: it is not merely a hedge or an insurance policy. It is a genuine long-term return asset that belongs in portfolios for positive reasons, not defensive ones alone.
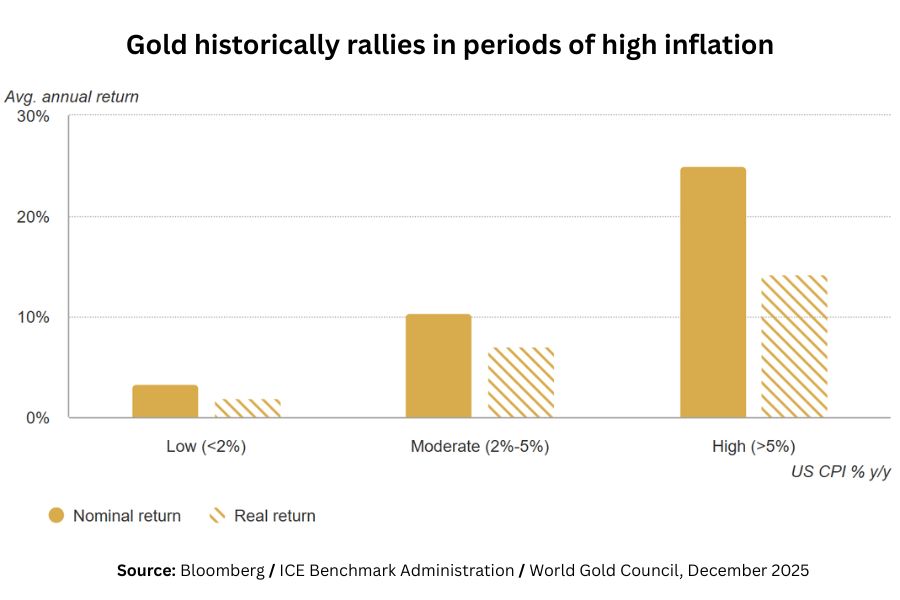
The chart above confirms the inflation-hedge argument with precision. During years of low inflation (below 2%), gold delivered approximately 3% average annual nominal return. During moderate inflation (2%–5%), that rose to 10%. During high inflation (above 5%), gold delivered approximately 25% average annual nominal return. The relationship is monotonic and consistent across 54 years of data. Gold does not merely preserve purchasing power during inflation. It amplifies it.
The inflation argument has direct relevance to the Digital Euro debate I examined earlier in this series. One of the ECB’s central arguments for the Digital Euro is that it would give European citizens a safe, inflation-resistant digital store of value. The data on gold’s inflation performance raises an uncomfortable question: if you want an inflation hedge, the ECB’s own charts confirm that gold has done the job for 54 consecutive years. The Digital Euro has not yet launched.
Less understood — and arguably more important in the current environment — is gold’s behaviour during periods of systemic stress. Across every major financial crisis since 2000 — the dot-com collapse, 9/11, the 2002 recession, the global financial crisis, COVID-19, and the 2025 tariff uncertainty — gold has delivered positive or near-zero returns while global equities collapsed. Gold’s negative correlation with equities increases precisely during the worst market environments — exactly when that negative correlation is most valuable.
An asset that works in boom, bust, inflation, and deflation is not a hedge. It is a structural portfolio component.
4. What 95% of Central Banks Know That Most Investors Don’t
The World Gold Council’s 2025 Central Bank Gold Reserves Survey documents a near-unanimous institutional consensus on gold that is rarely reflected in mainstream investment commentary. 95% of central banks expect global official gold reserves to increase over the next 12 months — the highest level in the survey’s eight-year history. 43% plan to increase their own institution’s gold holdings in the coming year, up from just 8% in 2019, with zero respondents anticipating a reduction.
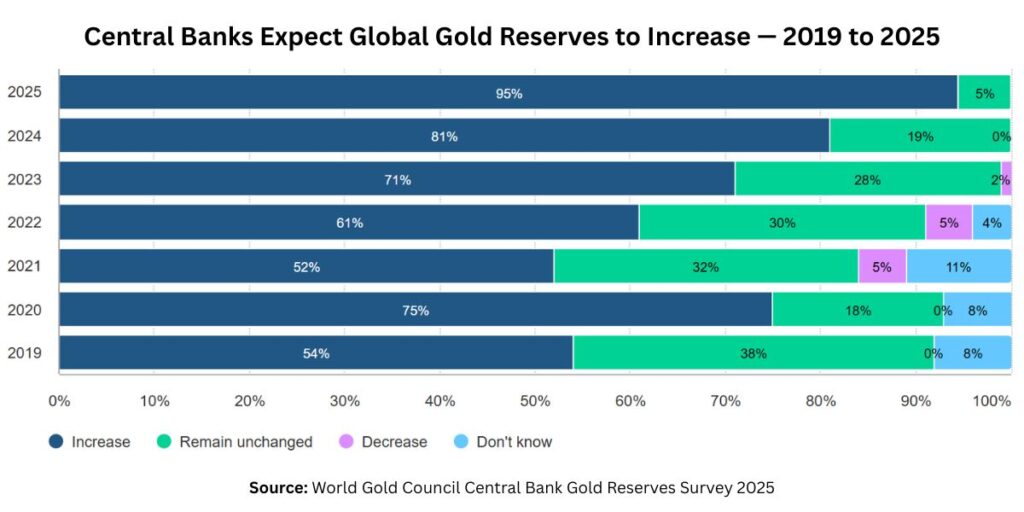
The trend captured in Chart 3 did not emerge overnight. It is the visible output of a decade-long structural reassessment by sovereign institutions worldwide. To understand what is driving it, the ECB’s June 2025 analysis provides the most granular institutional data available — and it contains a finding that deserves careful attention.
In 2024, central banks accounted for more than 20% of total global gold demand — double their share from the 2010s. That shift is not captured by a single year’s survey. It is visible in a decade of hard demand data.
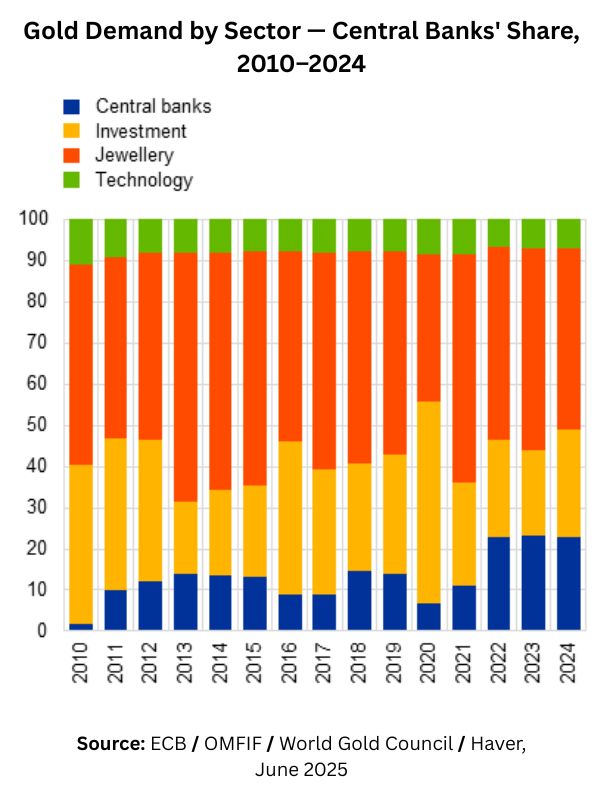
The ECB sector data above tells the structural story in one image. The dark blue bars — central bank demand — were a minor fraction of total gold demand throughout the 2010s, hovering between 5% and 15%. Then 2022 arrived. From that year onwards, central banks have consistently represented over 20% of all gold purchased globally. This is not a temporary anomaly. It is a permanent realignment in who buys gold and why.
The timing is not coincidental. 2022 is the year $300 billion in Russian reserves were frozen. The dark blue bars in the chart are, in a very real sense, the visual signature of that single geopolitical event — multiplied across dozens of sovereign institutions that drew the same conclusion independently: gold that cannot be frozen is worth more than reserves that can.
The reasons behind these decisions are documented with unusual precision. The primary factors cited are: long-term store of value and inflation hedge, performance during times of crisis, and effective portfolio diversifier. What is new — and what connects directly to the geopolitical argument in the first part of this series — is the growing prominence of sanctions concerns and anticipated changes to the international monetary system, particularly among emerging market central banks. One in four explicitly cited these factors. In the ECB’s framing, gold is valued not only as a financial hedge but as a hedge against the rules of the existing system itself.
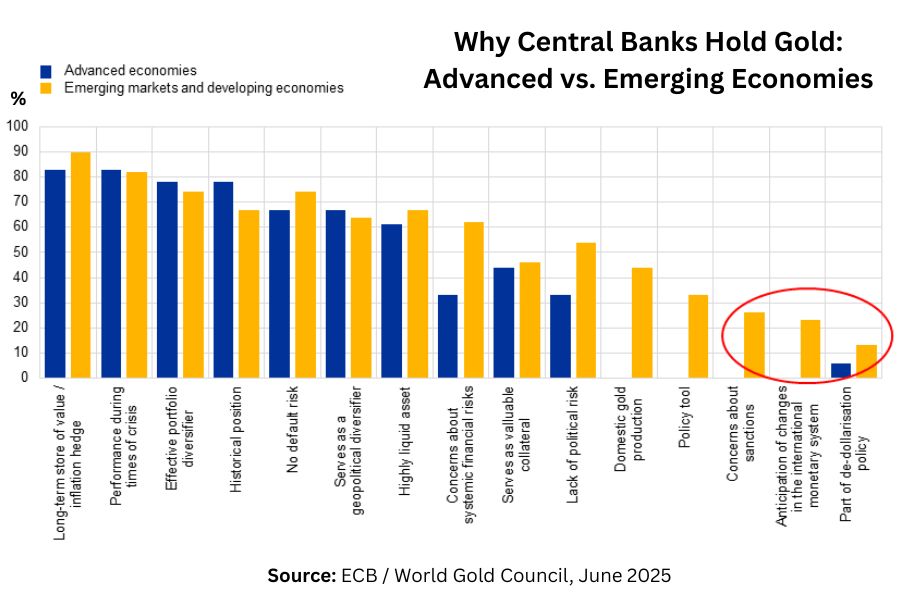
The ECB chart above shows the motivational split between advanced and emerging economy central banks. For traditional financial reasons, the two groups are broadly aligned. For geopolitical reasons — sanctions risk, de-dollarisation policy, anticipated monetary system changes — emerging markets score dramatically higher. These are the countries with the most to fear from the weaponisation of dollar reserves. And they are buying gold most aggressively.
The storage dimension reinforces this. Domestic gold storage is rising. Central banks are not merely buying gold — they are repatriating it from Western custodians, removing it from the reach of any foreign jurisdiction. The Bank of England and the Federal Reserve Bank of New York remain major custodians, but their dominance is quietly eroding. Physical gold in domestic vaults is the ultimate expression of monetary sovereignty in an era of financial weaponisation.
This dynamic mirrors the argument I made about Bitcoin in an earlier article in this series — that Europe’s debate about Bitcoin as a reserve asset is partly a debate about whether there exists any asset capable of providing genuine monetary sovereignty outside the dollar system. Gold does not solve that problem entirely. But it is the only asset with a 5,000-year track record of trying.
5. The Supply Constraint Nobody Is Talking About
The demand story for gold is well documented. The supply story is less discussed — and it may be the more important structural factor for long-term price trajectory.
Gold mine production reached a new record in 2025: approximately 3,672 tonnes. In context, this is not impressive. Mine production has grown from roughly 2,300 tonnes per year in the mid-1990s to 3,672 tonnes today — an increase of approximately 60% over three decades. In annual percentage terms, the above-ground gold stock grows at roughly 1.7% per year. The global money supply of major currencies has grown at approximately 7.3% per year over the same period. Gold supply is, by construction, structurally scarce relative to the monetary liabilities it is increasingly being asked to serve as a hedge against.
The recycling picture reinforces this argument. In 2025, despite a 65% surge in gold prices — which should, by normal commodity market logic, have triggered a flood of recycled supply as holders monetized their gains — global gold recycling rose by only 3%. People who hold gold are not selling it at these prices. This behaviour reflects a considered judgment that the conditions driving gold’s appreciation are structural and persistent, not temporary and reversible.
VanEck’s analysis introduces the most intellectually provocative dimension of the supply argument. Using balance-sheet mathematics — dividing central bank money liabilities by gold reserves and weighting by foreign exchange turnover — their team calculates that the price of gold fully equalising central bank M0 liabilities globally would be approximately $39,000 per ounce. Under a broader M2 framework, the implied price reaches approximately $184,000 per ounce. These are not price targets. They are theoretical reference points. But they illustrate something important: relative to the monetary liabilities it is being asked to hedge, gold at current prices is not expensive. It is, by this framework, still in the early stages of a structural repricing.
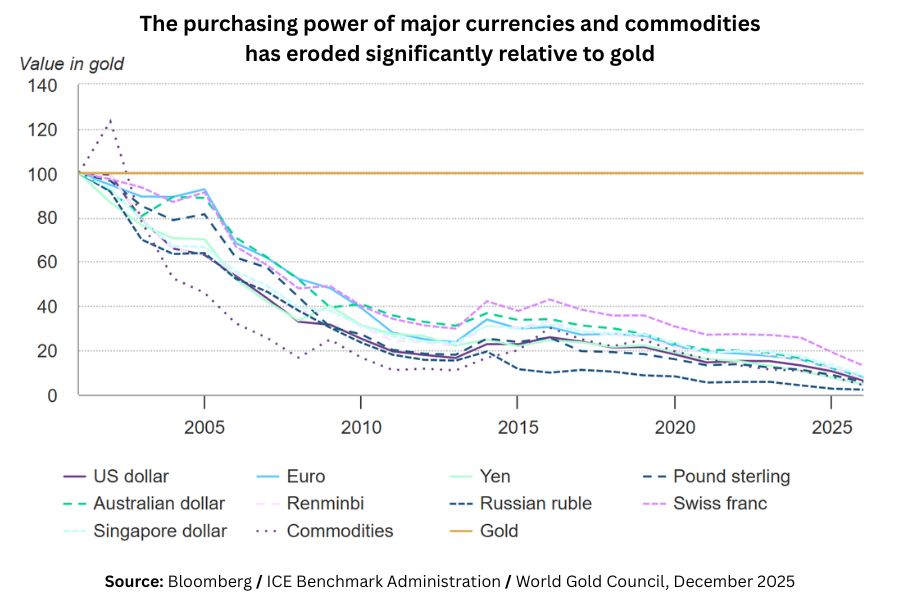
The chart above is the most powerful single argument for gold’s long-term role in any portfolio. Every major currency — the US dollar, euro, Japanese yen, British pound, Australian dollar, Chinese renminbi, Russian ruble, Swiss franc — has lost between 80% and 95% of its value relative to gold since January 2000. The commodities index has followed the same trajectory. Gold alone holds flat at 100 — the golden horizontal line that anchors the entire chart.
This is not a chart about gold’s performance. It is a chart about the performance of everything else. Every fiat currency in the world has been quietly, steadily, relentlessly devalued against the one asset that cannot be printed, cannot be frozen, and cannot be debased by any political decision anywhere.
Conclusion: Not a Relic. A Mirror.
Gold does not generate cash flows. It pays no dividend. It earns no interest. By the metrics of modern financial theory, it should be a dominated asset — perpetually inferior to income-producing alternatives. And yet since 2000, it has outperformed every major asset class. Since 2022, central banks have purchased it at historically unprecedented rates. In 2025, global demand exceeded 5,000 tonnes for the first time. 95% of central banks expect further accumulation.
There is a way to reconcile these facts with financial theory, and it is the most honest framing available: gold is not primarily a financial asset. It is a monetary asset — a claim on no counterparty, subject to no political jurisdiction, immune to confiscation and debasement. Its value is not derived from future cash flows. It is derived from the collective, global recognition that it is the one store of value that has survived every monetary system in human history, including all the ones that were supposed to last forever.
The Bretton Woods system was supposed to last forever. The euro was supposed to challenge dollar hegemony. It now holds 16% of global reserves, less than gold’s 20%. Tether — examined in an earlier article in this series — was supposed to democratise access to the dollar. S&P Global rates it Weak. Central bank digital currencies were supposed to make gold irrelevant. Central banks are buying gold at the fastest pace in fifty years.
Gold is not a relic of the past. It is a mirror of the present — reflecting, with uncomfortable precision, the state of confidence in the monetary systems that surround it.
When gold rises, it is not a statement about gold. It is a statement about everything else. And everything this two-part series has documented — the weaponisation of reserve assets, the erosion of dollar dominance, the broken correlation between gold and interest rates, the 95% consensus among central banks — is a statement about the current state of confidence in the monetary architecture of the 21st century.
The IMF still holds 2,814 tonnes of gold on its books at $48 per ounce — the price agreed at Bretton Woods in 1944. At current market prices, that gold is worth more than 85 times its book value. The institution designed to maintain the stability of the international monetary system is sitting on a treasure it has not revalued in eighty years. That detail alone — quiet, technical, almost administrative — captures something essential about the relationship between the official monetary order and the asset it has spent decades trying to forget.
Gold has not forgotten the monetary system. The monetary system is remembering gold.
References & Sources:
All sources used in this analysis are primary institutional publications, peer-reviewed academic research, or tier-1 financial media.
[1] World Gold Council — Central Bank Gold Reserves Survey 2025
[2] World Gold Council — Gold Demand Trends Full Year 2025, January 2026
[3] World Gold Council — Gold’s Key Attributes: Return, December 2025
[4] ECB — Gold Demand: The Role of the Official Sector and Geopolitics, June 2025
[5] VanEck — Gold Investment Outlook 2026, February 2026
[6] Arslanalp, Eichengreen & Simpson-Bell — Gold as International Reserves: A Barbarous Relic No More?, IMF Working Paper, January 2023
[7] Reuters via Yahoo Finance — Central Banks on Track for 4th Year of Massive Gold Purchases, June 2025
[8] Atlantic Council — Going for Gold: Does the Dollar’s Declining Share Matter?, December 2025
Disclaimer: This analysis is provided for informational purposes only and is based on publicly available institutional and financial documentation. It does not constitute financial or investment advice.
Did you find this article helpful?
Thank you for your feedback!